Corrections
There were a number of errors in my last post.
Error #1
The most egregious was in my interpretation of the high-performance Linpack (hpl) results. I was mystified by the fact that as I added nodes to the cluster performance would improve to a point and then suddenly drop-off. I attributed this to some misconfiguration of the test or perhaps a bottleneck in the interconnect, etc. In the back of my mind I had this nagging idea that there was some sort of “order-of-magnitude” error but I couldn’t see it. Then when I was reading a paper by computer scientist who was writing about running hpl it jumped out at me. The author said they measured 41.77 Tflops, but when I looked at their hpl output it looked like 4.1 Tflops… Then I realized my mistake. [caption id=“attachment_5209” align=“aligncenter” width=“807”] Taken from “HowTo - High Performance Linpack (HPL)” by Mohamad Sindi[/caption] There’s a few extra characters tacked-on to the Gflops number at the end of hpl’s output:
1.826e+01
When I first started using hpl, that last bit was always e+00 so I didn’t pay any attention to it. However at some point that number went from e+00 to e+01 without me noticing, and it turns out that change was significant. Since I didn’t notice this, I was mis-reading my results and doing a lot of troubleshooting to try and figure out why my performance dropped through the floor after I added a fifth node to the cluster. Once I realized the mistake I went back and reviewed the Mark I logs and sure enough, that mistake sent me on a wild goose chase and resulted in a seriously erroneous assessment of Mark I’s performance. The good news is that this means Mark II is considerably faster than I thought it was when I wrote about it earlier. The bad news is that this means Mark I is also faster, and my conclusion that Mark II was exceeding Mark I’s performance was incorrect. Knowing what I know now, Mark I was roughly 4x faster than Mark II in the 4x4 configuration. Performance parity between the two systems seemed too good to be true, so in a way this is a relief. It’s a little disappointing, but this doesn’t undermine the value of Mark II because in terms of physical size, cost and power consumption Mark II easily out-paces Mark I. I don’t have detailed power consumption measurements for either system yet, but if we compare their theoretical maximum power consumption, it’s pretty clear that in terms of flop-per-watt, Mark II is an improvement:
- Mark I: 40 Gflops, 4,000 watts (800 watts * 5 chassis) = 100 watts per Gflop
- Mark II: 18 Gflops, 75 watts (15 amps @ 5 volts * 1 chassis) = 4 watts per Gflop
Error #2
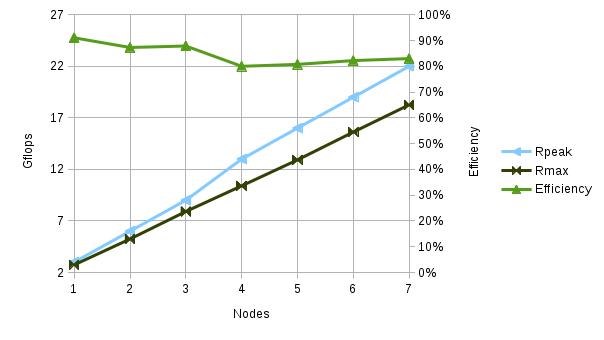
The second mistake I made related to the clock speed of Mark II’s compute nodes. The SOPINE module’s maximum clock speed is 1.2Ghz and this is what I used when determining the theoretical peak (Rpeak) and efficiency values for the machine. I knew that this speed might be reduced during the test due to inadequate cooling (cpu scaling) but I thought it was a reasonable starting point. Based on this I was disappointed to find that no matter how hard I tweaked the hpl configuration, I couldn’t break 25% efficiency. I even added an external fan to see if added cooling could move the needle but it seemed to have no effect. I took a closer look at one of the compute nodes during a test run and this is when the real problem began to become apparent. I wasn’t able to find the CPU temps in the usual places, and I couldn’t find the CPU clock speed either. I had read something about issues like this being related to kernel versions so I looked into what kernel the compute notes were running. As it turns out they are running the “mainline” kernel, and the kernel notes on the Armbian website state that cpu scaling isn’t supported in this kernel. This means the OS can’t slow-down the CPU if it gets too hot, so the clock is locked at a very low speed for safety’s sake. From what I can tell that speed is 408Mhz, around 1⁄3 of the speed I expected the CPU’s to be spinning at. Using this clock speed to calculate the efficiency, my hpl results look a lot better: 
What’s next?
With these errors corrected I was able to execute a series of tests and confirm that Mark II’s system efficiency is well within acceptable values. This means that if I address the clock speed issue, hitting 50 Gflops should not be unreasonable (that’s only about 75% efficient, and the worst efficiency in the last round of tests was 80% or better).  Getting the clock speed up to max (and keeping it there) will require cooling, so I’ve picked-up some heatsinks for the compute module SOC’s and I’ll be turning my attention to completing the front-end interface hardware (which includes dynamic active cooling). Once I have that in place I’ll turn my attention back to performance tuning and see how far we can go. One other side-node, the results of the last batch of tests indicate that there’s room to improve performance reasonably by adding nodes beyond the 8 that one Mark II chassis can contain. It might be interesting to assemble a second chassis to see how linear performance scales across more nodes. Since I’ve heard some interest in developing an “attached processor”-style chassis for the Clusterboard this might be something worth exploring.
