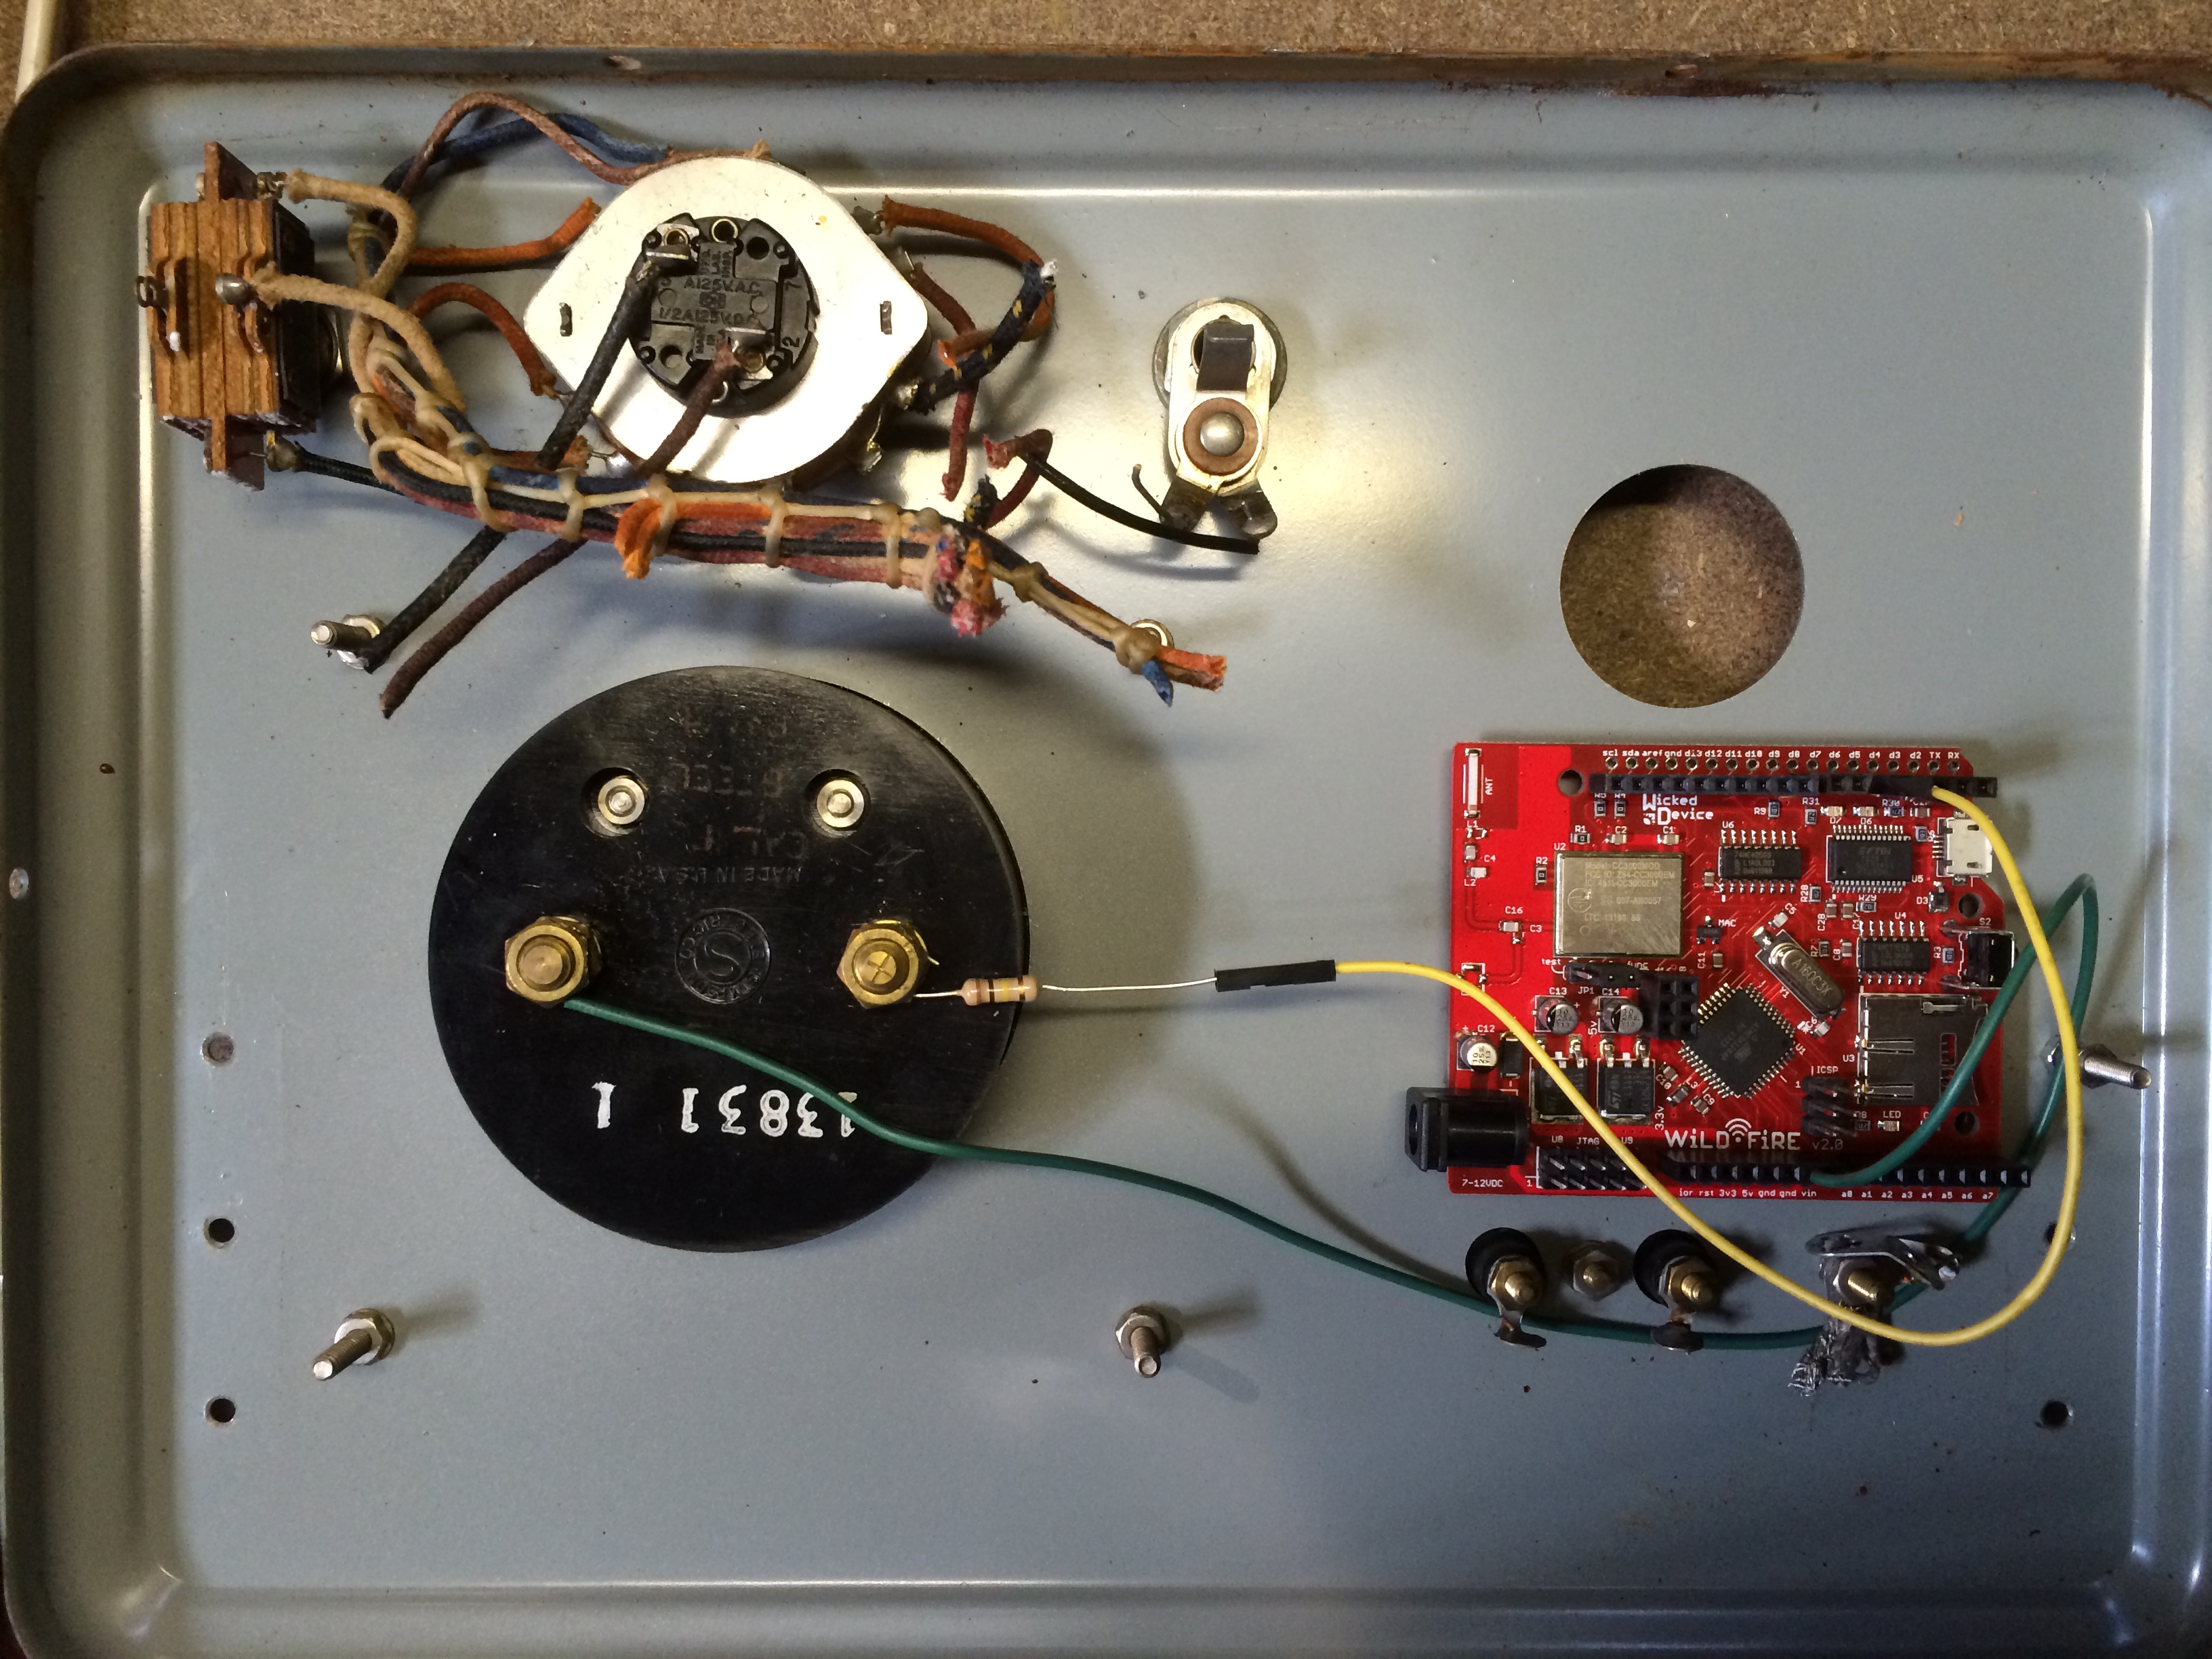
If all is well we can move on to the software side of the project.
To display network utilization on the gauge we need to measure it somehow. There are a number of ways to do this but the most universal is to use a protocol called SNMP (Simple Network Management Protocol). SNMP provides a lot of information, and it’s supported by most network devices, so it’s a good tool for this job, even if it’s a little tricky to use (dispite its name). Fortunately there’s a python library called pysnmp that works well and is fairly easy to work with.
The hardest part about getting the bandwidth utilization via SNMP is figuring out what to monitor. SNMP uses something called an “OID” to identify each parameter that can be monitored and determining the OID for the interface (port) on your router that you want to monitor can be challenging depending on how well documented the router is. In my case I’m using an Apple Airport Extreme, and by poking around on the web a bit and using a tool called snmpwalk I was able to get a list of interfaces out of the router. From there it was a matter of figuring out which interface I wanted to monitor, and which counter of the interface would tell me what I wanted to know (the inbound data rate). I could write a few paragraphs about this but I’ll leave that as an exercise to the reader and get back to the fun part for now.
Once you know the OID of the counter you want to monitor you’ll find that you can’t simply read it and display that value on the gauge and see how much bandwidth you’re using. SNMP counters start at zero and then go up until they reach their maximum value and then reset to zero again, so in order to determine how much bandwidth is being used at any moment in time it’s necissary to take two readings and determine the difference between the two, which is the number you want to display on the gauge.
I’m used to thinking in terms of bits per second so my code takes a reading once every second and subtracts the value read in the previous second from the current one. An additional kink is that it sometimes takes longer than a second to send data to RESTDuino, so I collect 10 samples and average them before sending them over to RESTDuino for display on the gauge.
With this little bit of python we can now measure the utilization of the network interface and display it on the analog gauge. Of course we could measure any number of things and display them on the gauge in a simular fashion, or even add another gauge or other indicators (LED’s, buzzers, etc.) by connecting additional WiLDFiRE pins and sending additional HTTP requests from the python script (I’m planning to do just this to provide a red light indicating that utilization has crossed into the “danger zone”).
This is just one example of how the WiLDFiRE board running RESTDuino makes it easy to create physical things that interact with the digital world. It’s certainly possible to do the same thing with other components, but by exposing Arduino functionality via a REST interface it’s possible to build Arduino- based devices with no Arduino programming, and since the WiLDFiRE board integrates wireless networking and pre-installed RESTDuino firmware, the complexity of selecting an Arduino board, network shield and configuring them is eliminated, allowing you to focus on the software part of the project.
The python code for the software side of this project can be found here in the https://github.com/jjg/RESTduino RESTduino repository.

